NCAA Basketball Analytics - Updated - 10/26/2025
Main Page Todays Games Yesterdays Games Tourney Central Conference Rankings Player Rankings Tools Team Stats Raw Data Blog AboutUpdating Game Predictions for the 2017 Season - 11/6/2016
As long as I've been doing this site (since 2011), the rankings and game prediction methodology has been essentially unchanged. There are several different steps:
-1) Creating win probabilities for any margin / time / team strength combination using historical data
-2) Creating a weighted average win probability for each game (using the win probabilties)
-3) Creating team rankings based on average win probabilities (using the weighted averages)
-4) Creating a strength of schedule (SOS) for each team based on their opponents ranking (using the team rankings)
-5) Creating updated Team Rankings with an updated iteration using SOS (using the SOS)
-6) Creating game predictions based on Team Rankings (using the team rankings)
While I believe the key difference between my site and any other ranking system out there is my reliance on cumulative win probabilities, I've always felt that I haven't done enough in some of the other steps to truly maxmimize the usefulness and accuracy of my system. In an effort to both improve my system and I am working on a new methodology based on an updated linear regression and process that leverages R. The old methodology used a similar process but was created with a combination of Excel and SQL. You can find both my game history data and the regression code in R in the links below.
Game History Data (Excel) R Prediction Code
This is output of the new model I plan to use to predict scoring margin this year. It's a simple linear model based on four factors: the ranking of the two teams and two flags indicating neutral site and conference play, respectively.
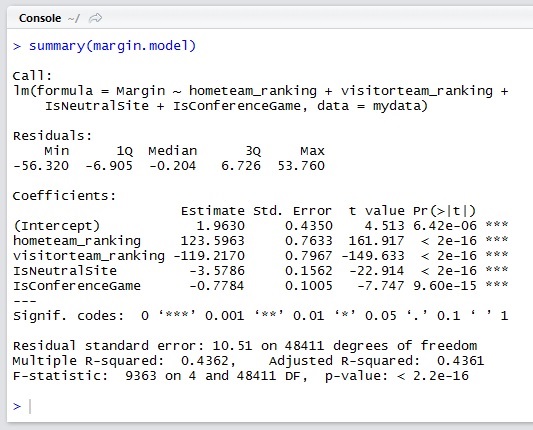
Example Game #1
Tennessee @ Vanderbilt (Home Conference Game for Vanderbilt)
Tennessee Ranking: .537
Vanderbilt Ranking: .597
Vanderbilt, the home team would be favored by: 1.963 + 123.5(.597) - 119.21(.537) - 3.57(0) - 0.77(1) = 10.96 points.
Example Game #2
Kansas vs. Vanderbilt (Non-Conference Neutral Site Game)
Kansas Ranking: .642
Vanderbilt Ranking: .597
Kansas the higher-ranked team, would be favored by: 1.963 + 123.5(.647) - 119.21(.597) - 3.57(1) - 0.77(0) = 7.18 points.
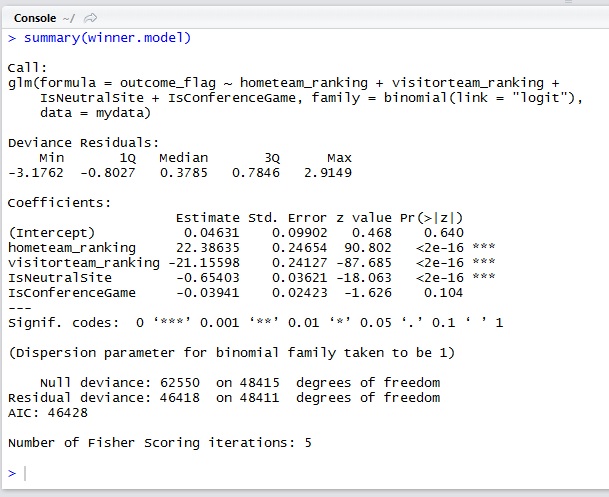
While the model to predict the scoring margin is a linear model, the updated model to predict the winner of the game is a logistic regression, using the glm function in R with the logit link. This measures the affect each of the same variables (home team ranking, visitor ranking, neutral site, conference game) has on the home team winning.
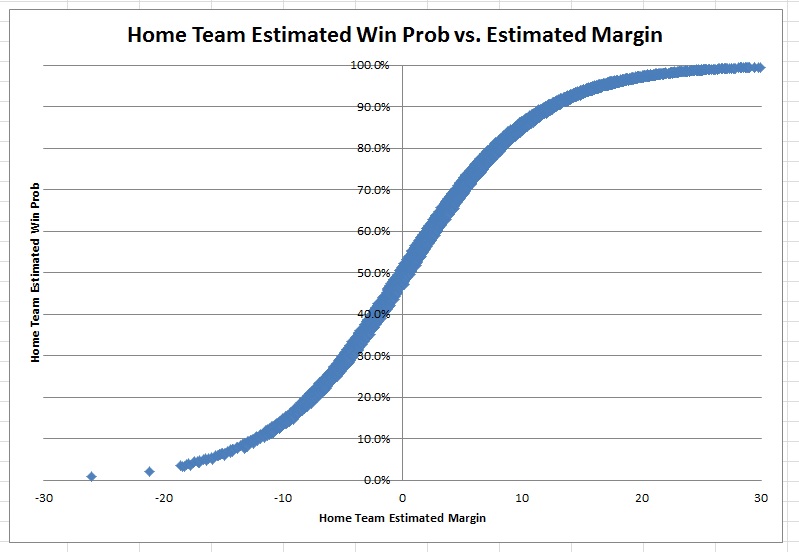
As you can see in this chart, the relationship between home team margin and win probability is a typical logistic curve. There is less data on the low-end because there are very few games where the home team is a huge underdog.
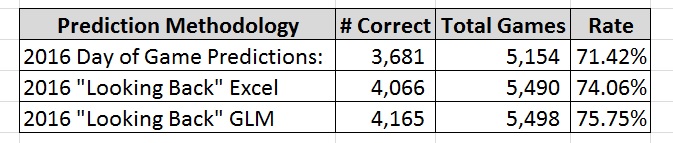
This table shows the difference between my old method and the new one. One problem in testing a new method after the season is that if I compare it to predictions made during the season, the "after-the-fact" rankings are almost guaranteed to be better because they have all the information for every game, while the "day of game" predictions only have the data of the games up until that day. The old model correctly predcited 71.42% of games in real-time, and improved to 74.06% when back-testing the final rankings across the whole season. The new system is about 169 basis points more accurate - increasing the correct rate from 74.06% to 75.75%.
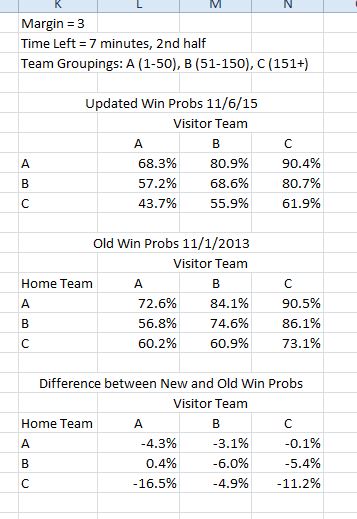
In addition to implementing these new rankings, I also plan to use similar methods to update the historical win probabilities rates (Step 1 from above) I've used to calculate the win probability metrics for each game. The chart below shows a sample of what this new data will look like (this part is still a work in progress - I'll have a separate post about this when it is complete).
Which Players Have Had the Biggest Regression Offensively This Year? - 2/10/2016
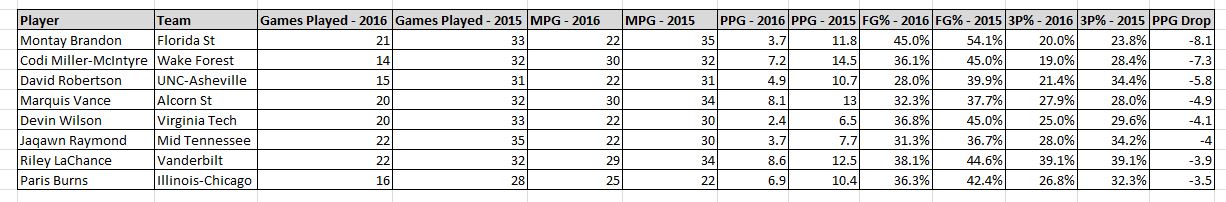
As a Vanderbilt fan, a recurring storyline this year has been Riley Lachance's lack of productivity. Last year, LaChance came out of basically nowhere to lead all SEC Freshman in scoring. He averaged 12.3 PPG and slashed 44/38/87 for the season. With basically the entire roster returning, Riley was expected to produce at a similar level and be a key part of a Vanderbilt team expected to compete for the SEC regular season crown and be 4-5 seed in the NCAA Tournament in March. However, with selection sunday just over a month away, the Commodores are at best on the back end of the bubble, and Lachance has seen his points, minutes, rebounds, assists, FG%, and TOs all go in the wrong direction. I think the most straightforward reason for his drop in production is that team's have had a year to scout and prepare for him, which is making it harder for him to get open looks. Secondly, Wade Baldwin's continued development as a top-level point guard has kept the ball in his hands and out of Riley's, which as affected his feel for the game. Kevin Stalling has removed Riley from the starting lineup - and I expect giving him a bigger role when in the game - even if in fewer minutes (like many NBA sixth men do) will help him find his footing.With all that said, I wanted to know just how notable Riley's PPG Drop from 12.5 to 8.6 was. I filtered for all players that have averaged over 20 minutes per game the past two seasons, and played in atleast 20 games last year and 10 this year. Lastly, I filtered for all players who's PPG drop was greater than 3.0 and their FG% drop was atleast 5%. Only 8 players matched that criteria. My best guess for Montay Brandon's fall off is the arrival of prized recruits Dwayne Bacon and Mailk Beasley. Both newcomers play the same position as Brandon, and they combine for over 33 PPG. Brandon's drop is the biggest, but its also notable that 3 of the top 8 players in this metric all play in the ACC. As you can see from the table below, Riley has the 7th biggest drop of any player in the country.
Update 2/11/2016 - Riley went for 2 points on 1/4 from the field 0/3 in a home win against Missouri last night.
Projecting the SEC - Big XII Challenge
The SEC and Big XII agreed to matchup their teams in a non-conference event, but instead of early December like most conferences have done in the past (most notably the ACC-Big Ten Challenge), this one is smack dab in the middle of conference play. It's a great way for the two conferences to measure themselves, even if it might be a distraction to some fans of conference play. The conferences did a good job of matching up the best teams to create the best matchups, and all the games will be on either ESPN, ESPN2, or ESPNU on Saturday, January 30th.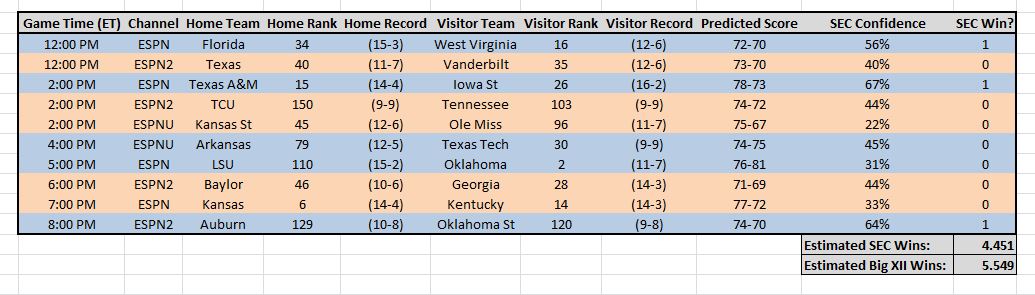
Each conference is hosting 5 games, and the early projections has the Big XII with a decent edge - favored in 7 of the 10 matchups and predicted to win just over 5.5 of the 10 games. The least contested game is Ole Miss @ Kansas State - where I have K State with a 78% chance to win. I will updated this both later in the week and during the day on Saturday.
Comparing Conf Luck vs. Non Conf Luck - 1/23/2016
We're early enough into conference play that we can compare each team's luck rating in conference play to non-conference play and see if we can find anything interesting. One thing I want to confirm is that the "luck" is randomly occuring and not something can be predicted. I've got a few ways to look at it, but the first is to compare each team's non-conference luck rating to it's luck rating in just conference play. If Luck was a skill, then we would expect some sort of correlation between the two values. If it truly is random, then a scatter plot of the two metrics should just look like a big blob.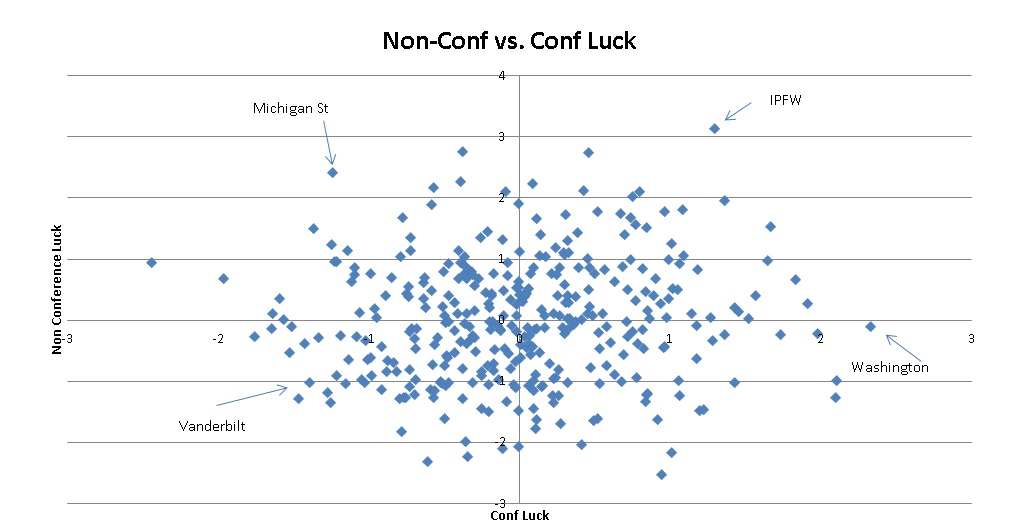
I think a straight forward obvious inspection of this chart would confirm the hypothesis that there is not a correlation between non-conf and conf luck. However, there are a few teams that were interesting to me that I'd like to discuss more.
Quadrant 1: IPFW (14-5, Summit 5-1)
At 14-5 overall and 5-1 in conference play, the Mastadons might look like the type of team that could have an outside shot at an at-large bid if they don't win the Summit League Tournament. Unfortunately, I've got them as one of the luckiest teams in the country. With a +4.4 overall luck rating they've got the profile of a typical 10-9 squad. And with a +1.3 luck rating in conference play, their 5-1 record is closer to 4-2. This also matters because I have S Dakota St (at 4-2 in Summit league play) with a negative luck rating and nearly 100 ranking spots better than IPFW. It's not a huge difference, and there isn't much competition for their tournament bid, but it appears IPFW is enjoying a luck-fueled run that will probably end very soon.Quadrant 2: Michigan St (16-4, ACC 3-4)
The top left quadrant corresponds to negative conf luck and positive non-conf luck, and the team that is the most extreme example there is Michigan St. Michigan St made it out of non-conference play as the #1 ranked (and undefated) team despite what I thought was an overrated (lucky) profile. They had extremely close and comeback wins again Kansas, Providence, Louisville, Florida, and Oakland. Obviously Denzel Valentine's injury affected them at Iowa, but despite the expectation that they'd come back down to earth, they've regressed in the other direction, and now are one of the unluckiest teams in the country in conference play with several big wins and two extremely unlucky losses against Wisconsin and Nebraska.Quadrant 3: Vanderbilt (11-7, SEC 3-3)
Vanderbilt's profile has been very interesting as well. The Commodores started the year off 5-0, with 4 easy wins and a dicey OT come back against an underrated Stony Brook team. After losing to Kansas and a close road game at Baylor, Vanderbilt's tourney resume was still looking solid. However, after losing close games at home to Dayton, at Purdue, and then dropping the first three conf games against LSU, Arkansas, and South Carolina in dramatic fashion, Vanderbilt found themselves on the wrong side of the bubble. Despite winning three straight conference games, Vanderbilt's profile is still extremely unlucky because they have not had a close win all year outside of the game against Stony Brook before Thanksgiving. Vanderbilt's presence in Quadrant 3 is represented by equally bad luck in both non-conference and conference play. This bad luck is why a team with a mediocre 8-7 record found themselves rated in the top 40 on both my site and KenPom.com last week.Quadrant 4: Washington (13-5, Pac-12 5-1)
Washington and Clemson are notable because they had little to no luck in non-conference action but have been very lucky in conference play. Washington, despite a Pac-12 leading 5-1 record is ranked 10th out of 12 in the Pac-12 in my ratings and predicted to go 5-7 over the last part of the season and finish in the middle of the pack at 10-8. The Huskies beat UCLA by 3 in Double OT at home (43% win prob), USC at home by 2 (11% win prob), Wazzu on the road by 4 in OT (47% win prob), Arizona St on the road by 4 (68%), and got a solid 92% win prob at home against Colorado. The one loss is a 32 pt drubbing by Arizona (5%). All those close wins are unsustainable and I expect that to catch up with them.Despite not being as extreme, Clemson - who reeled off 3 consecutive wins over ranked ACC foes - has a similar profile and I expect them to similarly finish 10-8 in ACC play.
Team Metrics
| Team | Rank | Record | Conf Record | Luck Rating | Non Conf Luck Rating | Conf Luck Rating |
|---|---|---|---|---|---|---|
| IPFW | 153 | (14-5) | (5-1) | 4.451 1 | 3.13 1 | 1.29 17 |
| Michigan St | 47 | (16-4) | (3-4) | 1.169 70 | 2.41 4 | -1.24 331 |
| Vanderbilt | 35 | (11-7) | (3-3) | -2.40 345 | -1.01 293 | -1.39 337 |
| Washington | 88 | (13-5) | (5-1) | 2.230 20 | -0.10 186 | 2.33 1 |
A link to all this data can be found here: https://www.dropbox.com/s/235g3h7kl0ywrb1/luck_20160123.xlsx?dl=0.
Putting Computer Rankings in Context - 3/1/2015
With BYU's win last night, the quality of their tournament resume became a hot topic. Part of the debate centered on how many "good" wins BYU has - and that their win over Gonzaga was the only "Top 50" win on their resume. Before getting into more details - I want to share a small exercise:Check out these blind resumes - which team is the strongest? Click the buttons below to see which team is which.
| Team One | Team Two | Team Three | Team Four |
| Ranking: 39 SOS: 61 Record vs. Top 50: (1-6) |
Ranking: 74 SOS: 90 Record vs. Top 50: (1-4) |
Ranking: 63 SOS: 95 Record vs. Top 50: (2-5) |
Ranking: 46 SOS: 82 Record vs. Top 50: (3-5) |
| Temple (RPI) |
Temple (BPI) |
Temple (KenPom) |
Temple (SevenOT) |
While I believe my rankings are a good indicator of the quality of a team, I recognize that every ranking system has its own built-in biases, as do the people that debate them. Much of the debate over the merit of BYU's lone "Top 50" win is that Top 50 is arbitrary. I completely agree with this - beating #70 on the road is better than beating #40 at home, and there are many other variants of this point. However, I don't think enough press is given to how much variability there is between all the different ranking systems. As much debate as there is on what a team should be "ranked" - I think looking at SOS is even worse. Teams will get credit for having a "Top 25" SOS, but it could be in the 60s on a different site. I know it sounds backwards as someone who is supposed to be analytical - but sometimes I think it would be better just to assign letter grades and not try to quantify the difference between #27 and #40.
This problem can be especially magnified by clustering in the rankings. When we see the rankings, I think we assume that the teams are equally spaced along some domain. This is rarely the case. For example, on my own site, Kentucky is ranked #1 at .691, and Grambling St is last at .302 - a difference of .389. With 351 teams, each team should be about .0011 apart. Valpo (ranking #67) has a score .567 which means I should expect the 91st ranked team (Evansville) to have a team score of .541. Because these teams are very clustered, the gap between each team is very small - which means #91 Evansville has a score of .553 - 12 basis points higher.
Copyright: Mark Bashuk, 2016
E-Mail: sevenovertimes@gmail.com
Twitter: @SevenOvertimes